Shear wave model HMSL-S06:
Click to download
Compressional wave velocity model HMSL-P06:
Click to download
Houser et al. GJI, 2008
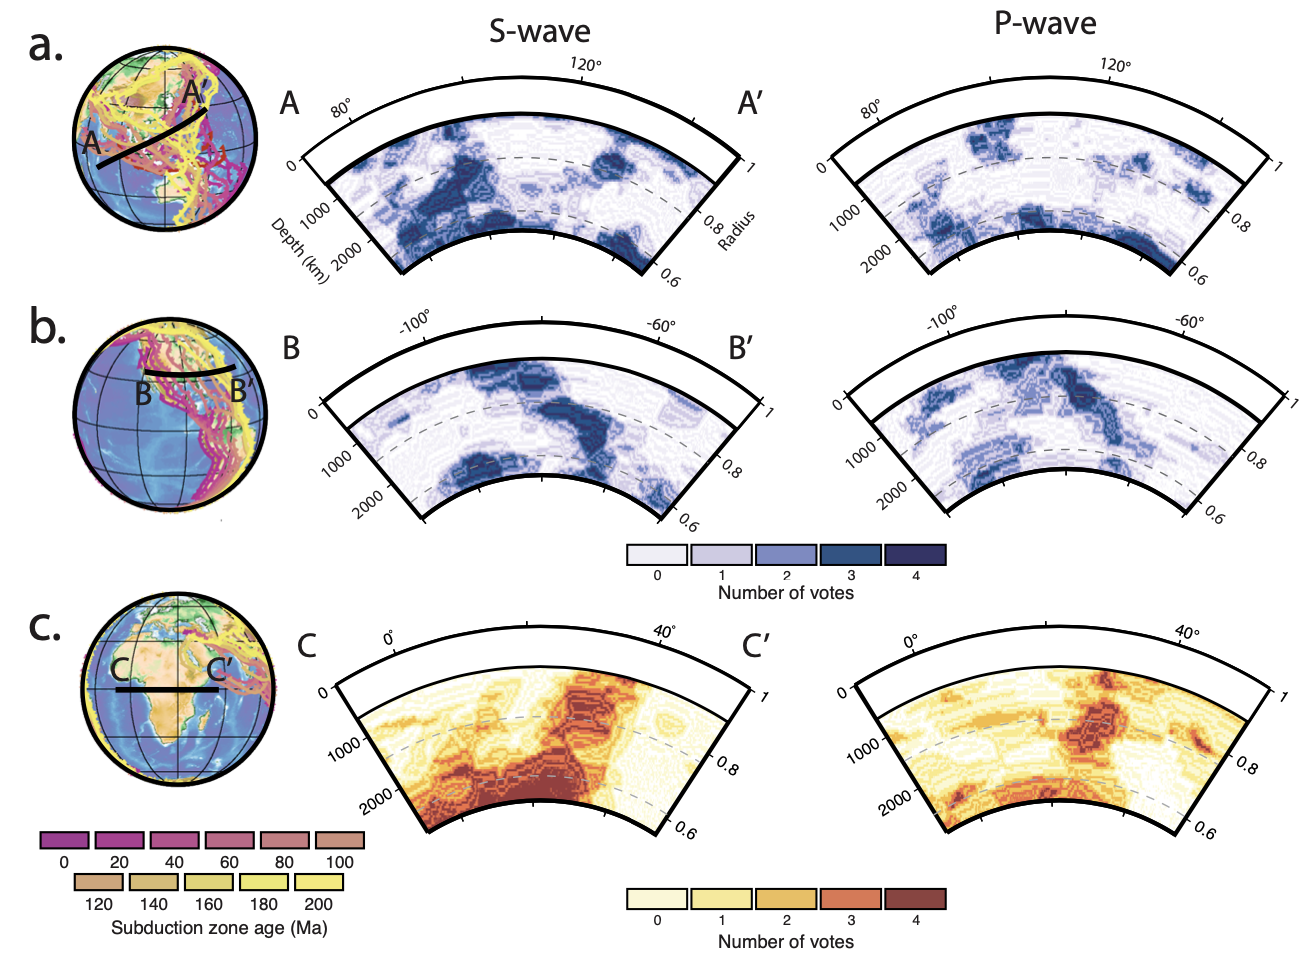
These Vp and Vs models are based on surface wave data for the upper mantle and body wave travel time data for the lower mantle. The bulk of the S, SS, P, and PP travel times were measured using cluster analysis. Phases such as ScS-S, SS-S, and PP-P from previous studies were also included. While tomographic models are nice to look at, they are also useful tools for extracting information about Earth dynamics and state as described below.
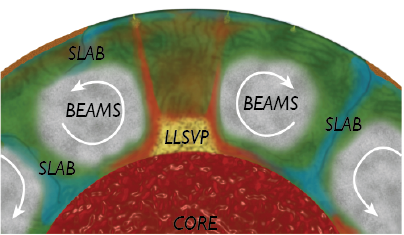
The
BEAMS model (bridgmanite enriched ancient mantle structures) proposes that the Earth's lower mantle could be more silica rich than the upper mantle and shows how the subsequent evolution is consistent with current seismic structure. The high viscosity of the lower mantle for Earth and other rocky planets could help sustain global mantle convection for billions of years.
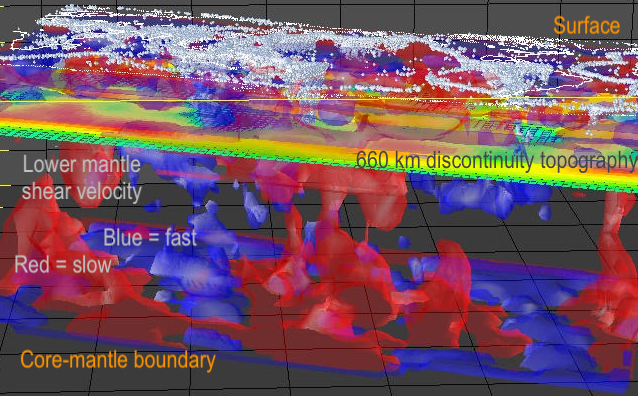
We see seismically fast (usually plotted blue) regions that extend from current and ancient subduction zones which appear to be subducted oceanic crust and upper mantle plunging across the mantle and collecting above the core-mantle boundary. Seismically slow (usually plotted red) areas occupy continent-sized regions at the core-mantle boundary with slow velocities extending to the upper mantle which appear to be linked to ocean island volcanos and hot spots.
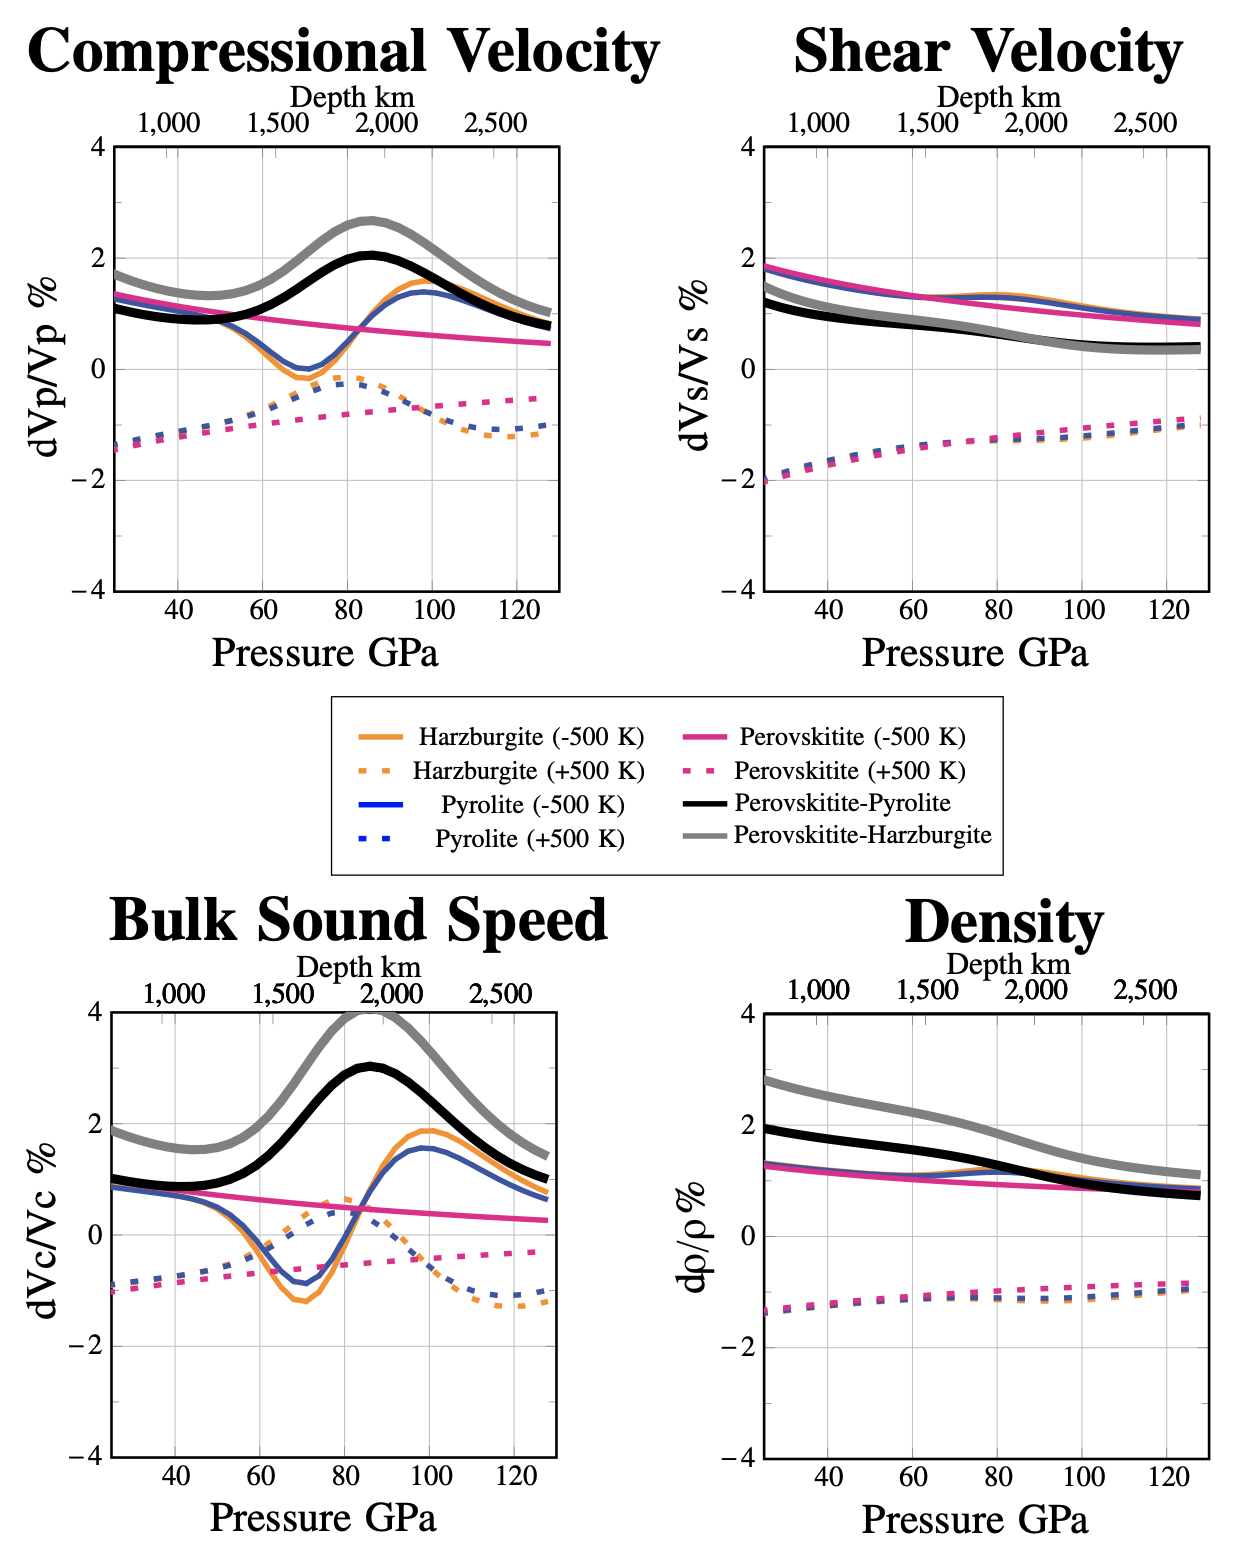
The iron spin crossover, when electrons transition from a high-spin to a low spin state, has been expected to cause changes in P-wave velocity in the mid-mantle (see velocity sensitivity figure at right) which has eluded seismic detection for over a decade. The question was: are the predictions of the iron spin crossover applicable to our understanding of Earth's composition?
Combining observations from seismic tomography models using the vote map method, mineral physics calculations, and insights from geodynamics,
we identified the unique seismic signal of iron spin crossover in these fast and slow velocity regions. The observation is possible because these regions are concentrated in the mineral ferropericlase (Mg,Fe)O. Oceanic basaltic crust forms from partial melting of the upper oceanic mantle leading to a crust that is rich in Si and mantle rich in Mg. Identifying oceanic plates in the lower mantle and their regional concentration rather than even distribution across the mantle indicates that the mantle is a mosaic of rock with differing compositions and temperatures which hold the key to our planet's history.
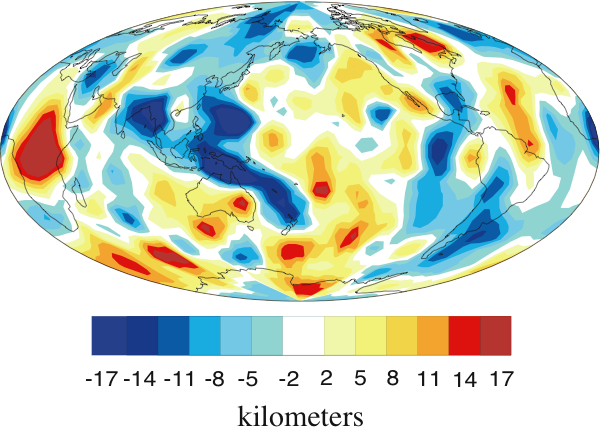
Transition Zone Topography
I also make maps of topography of the 410 km and 660 km discontinuities and likewise transition zone thickness
Houser et al., GJI, 2008. I followed up with analysis to interpret these maps along with seismic tomography to understand the
thermal and composition contributions to these seismic observations.
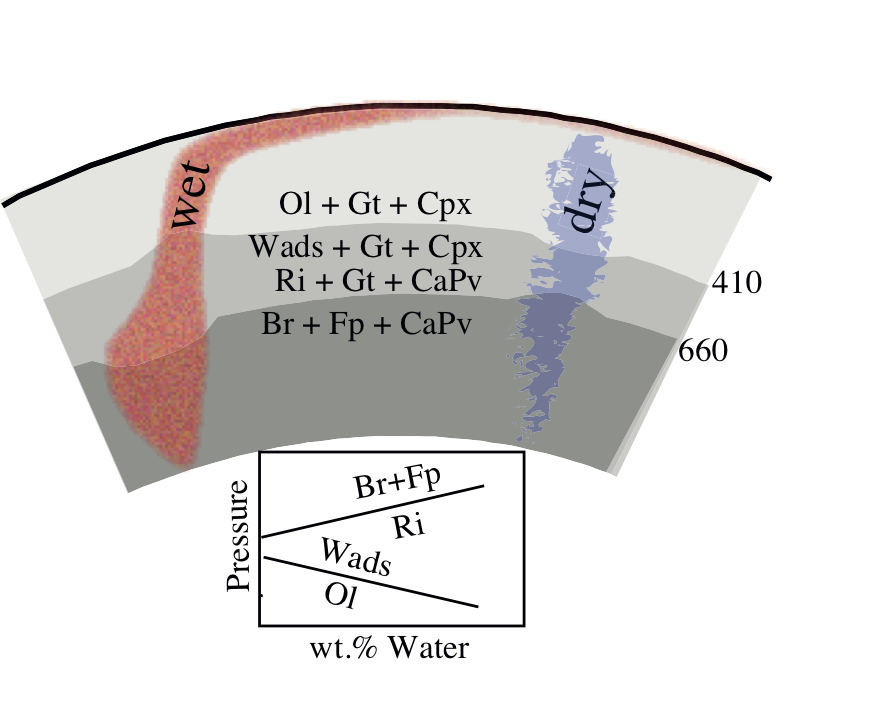
Water in the Mantle
While some minerals in the mantle transition zone are capable of holding water, is it actually there? Using results from the studies mentioned above, transition zone topography and seismic tomography,
the mantle transition zone appears to be quite dry. If the transition zone minerals are dry, then it is likely that the mantle as a whole is also dry. Thus, it may not take much water to explain the amount of water we observe: 1 ocean at the surface, maybe 1-2 oceans worth of hydrogen in the upper mantle, and 1-2 oceans worth of hydrogen in the transition zone. We studied the
flux of water between the surface and interior by using the hydrogen isotopes, that is the ratio of deuterium to hydrogen, D/H. There are different scenarios that can explain the current observations, so more measurements in older rocks are necessary. Of course when discussing water in a planetary context, questions of "habitability" often arise;
see this comment on why that may not be the best approach when considering rocky planets.
Collaborations
Communication
📮 Mailing address
2-12-1-I7E-311 Ookayama, Meguro-ku,
Tokyo 152-8550, JAPAN
📍 Physical address
Ishikawadai building No.7, 3rd floor room 316,
1 Chome-31 Ishikawacho, Ota-ku,
Tokyo 145-0061