|
Christine Houser
Planet Interior Investigator at the Earth-Life Science Institute |
||||
|
|
Research Areas:
|
|
Tomography:
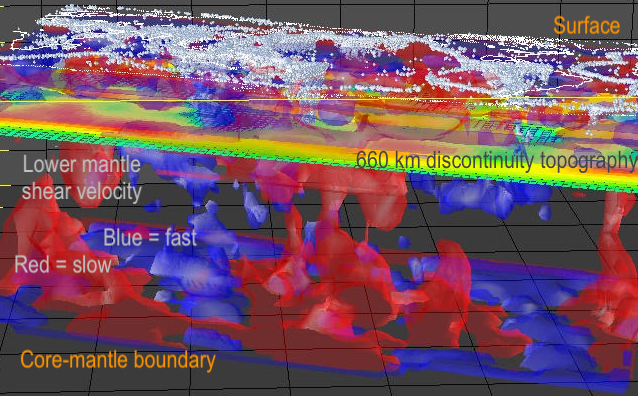
Shear wave model HMSL-S06: Click to download |
|
|
|
The BEAMS model (bridgmanite enriched ancient mantle structures) proposes that the Earth's lower mantle could be more silica rich than than the upper mantle and shows how the subsequent evolution is consistent with current seismic structure. The high viscosity of the lower mantle for Earth and other rocky planets could help sustain global mantle convetion for billions of years.
|
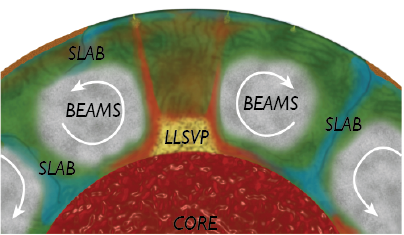
BEAMS cartoon: The stronger Si-rich regions (gray) of the lower mantle persist and preserve the channels of oceanic plate subduction (blue) and return flow of heat from the core-mantle boundary (red). |
|
|
We see seismically fast (usually plotted blue) regions that extend from current and ancient subduction zones which appear to be subducted oceanic crust and upper mantle plunging across the mantle and collecting above the core-mantle boundary. Seismically slow (usually plotted red) areas occupy continent-sized regions at the core-mantle boundary with slow velocities extending to the upper mantle which appear to be linked to ocean island volcanos and hot spots. |
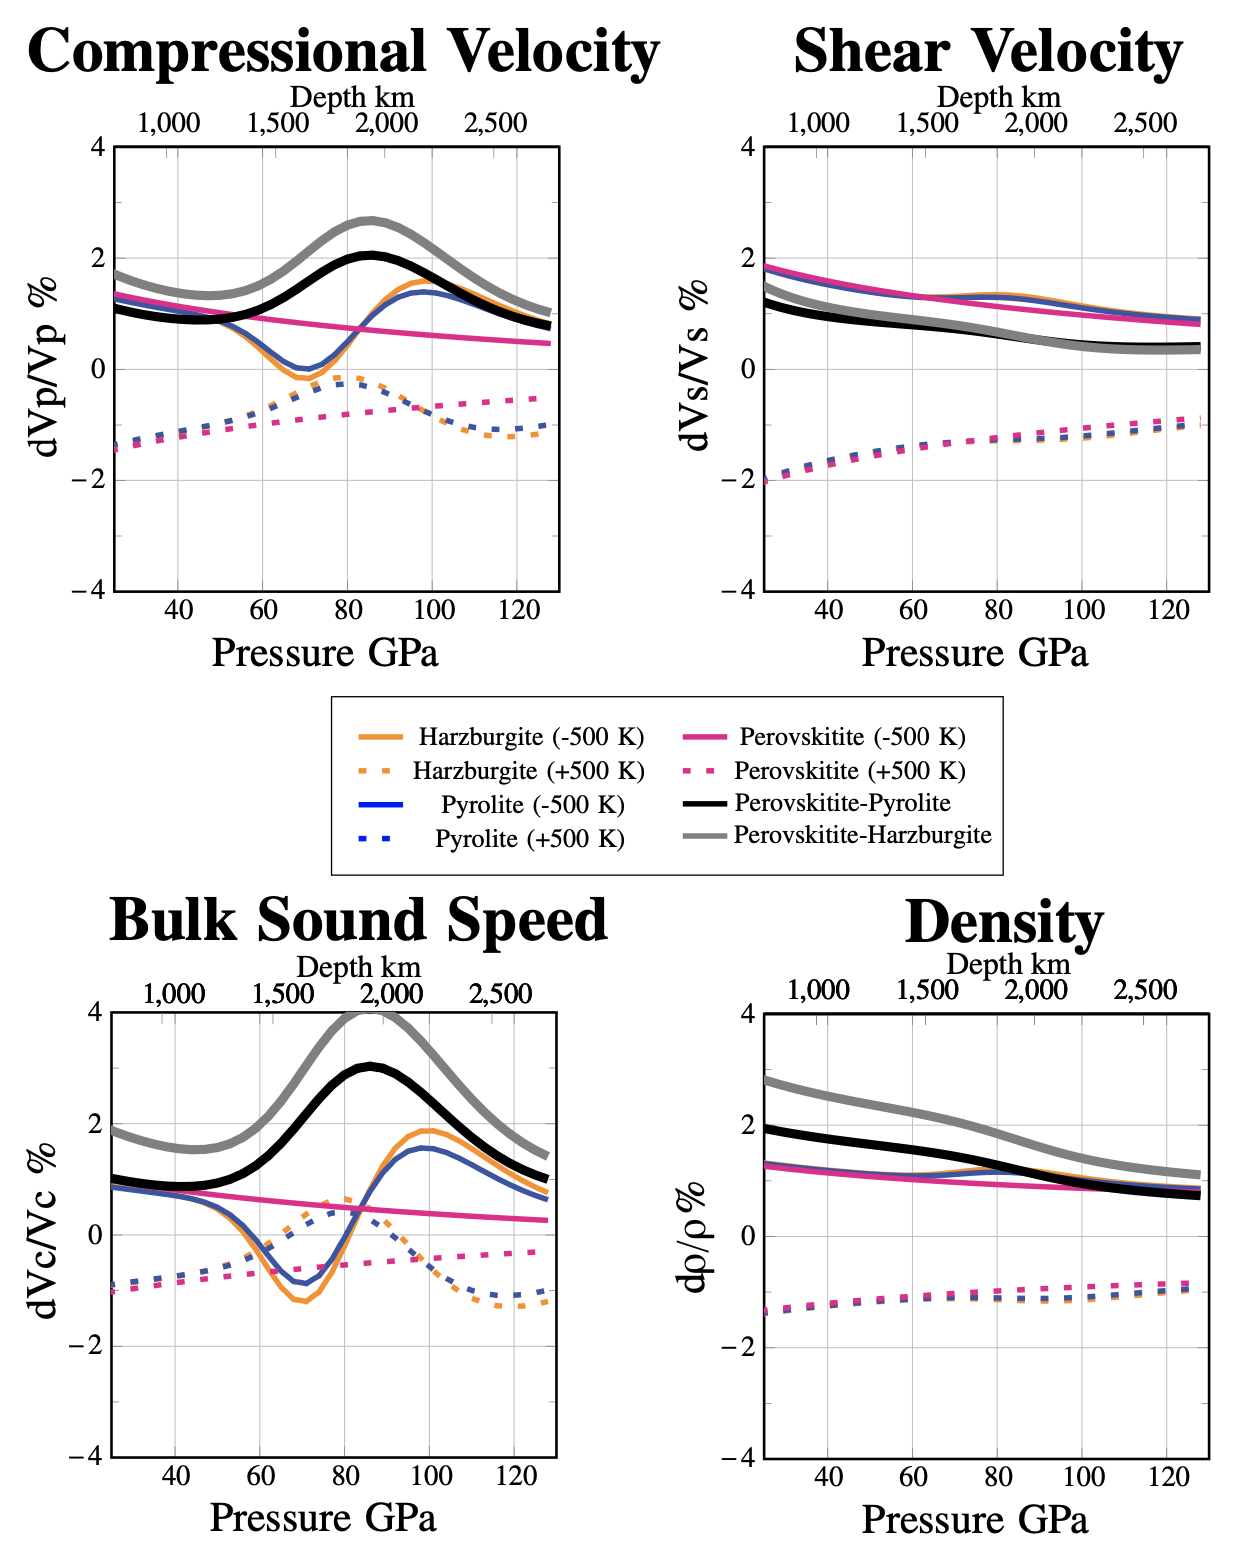
Sensitivity of seismic velocity and density to temperatue and composition. 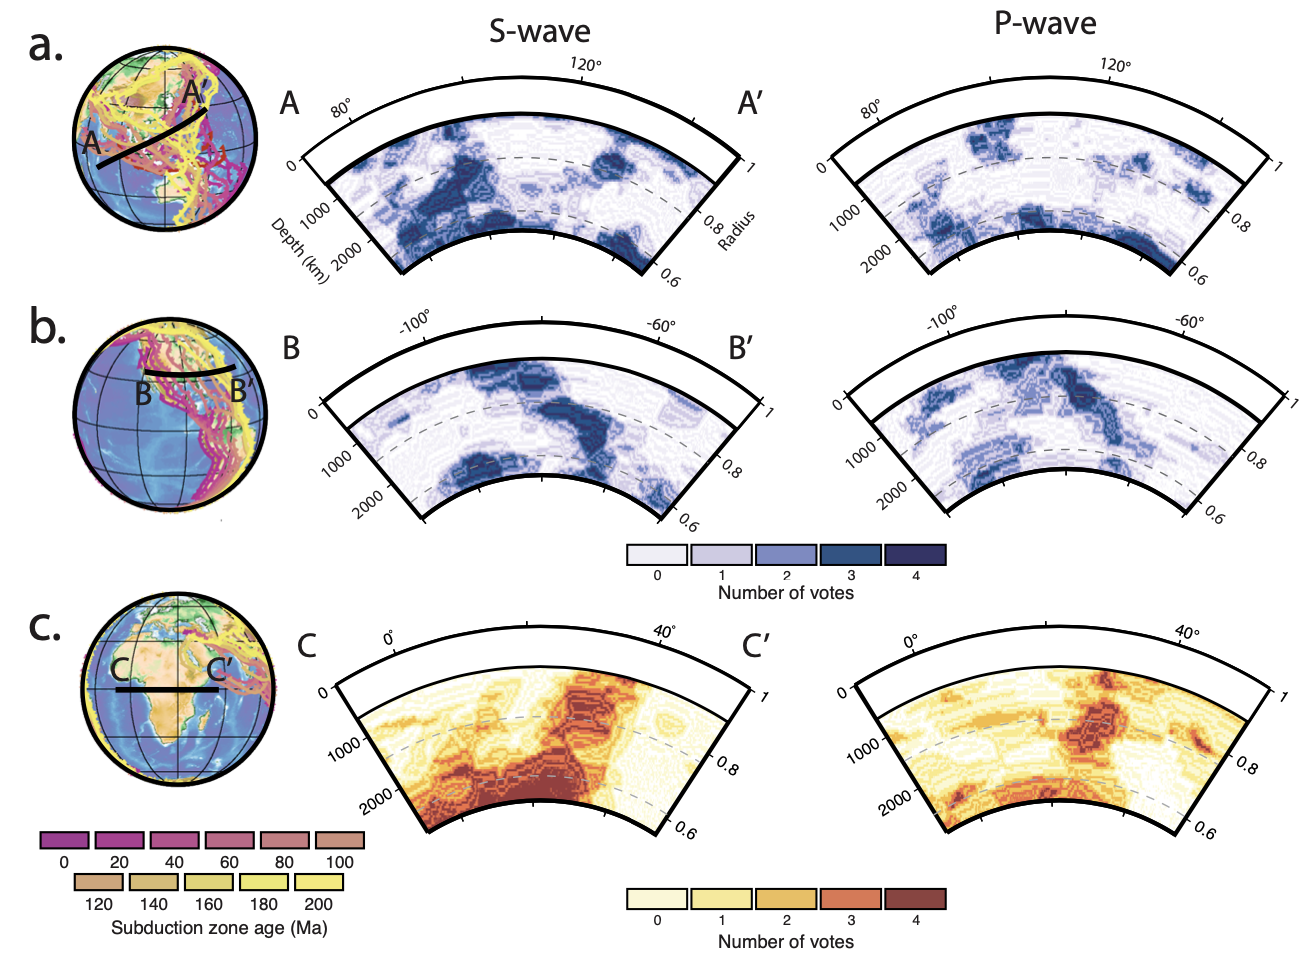
Side view of Earth's mantle highlighting where seismic tomography models identify fast (blue) and slow (red) rock in the lower mantle. The S-wave models show greater continuity and agreement than P-wave models. The iron spin crossover does not effect S-wave velocity, but has a temperature dependent effect on P-wave velocity localized to the mid-mantle. The greater cohernce of S-wave velocity with a disruption in P-wave velocity matches the unique seismic signal predicted for the iron spin crossover. |
|
|
I also make maps of topography of the 410 km and 660 km discontinuities and likewise transition zone thickness Houser et al., GJI, 2008. I followed up with analysis to interpet these maps along with seismic tomography to understand the thermal and composition contributions to these seismic observations EPSL 2010 EPSL 2016.
|
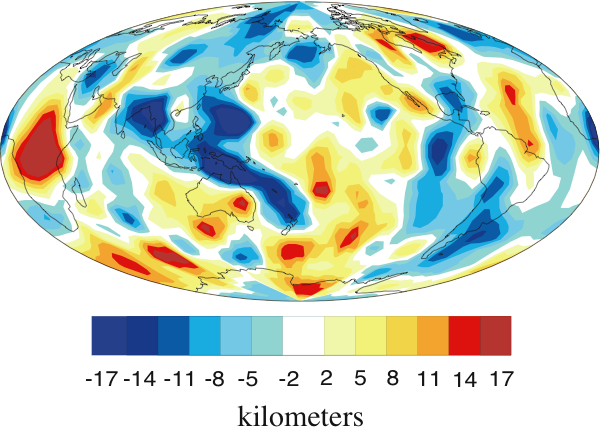
Transition zone thickness |
|
|
While some minerals in the mantle transition zone are capable of holding water, is it actually there? Using results from the studies mentioned above, transition zone topography and seismic tomography, the mantle transition zone appears to be quite dry. If the transition zone minerals are dry, then it is likely that the mantle as a whole is also dry. Thus, it may not take much water to explain the amount of water we observe, 1 ocean at the surface, maybe 1-2 oceans worth of hydrogen in the upper mantle, and 1-2 oceans worth of hydrogen in the transition zone. We studied the flux of water between the surface and interior by using the hydrogen isotopes, that is the ratio of deuterium to hydrogen, D/H. There are different scenarios that can explain the current observations, so more measurements in older rocks are necessary. Of course when discussing water in a planetary context, questions of "habitability" often arise, here is a brief comment on why that may not be the best approach when considering rocky planets.
|
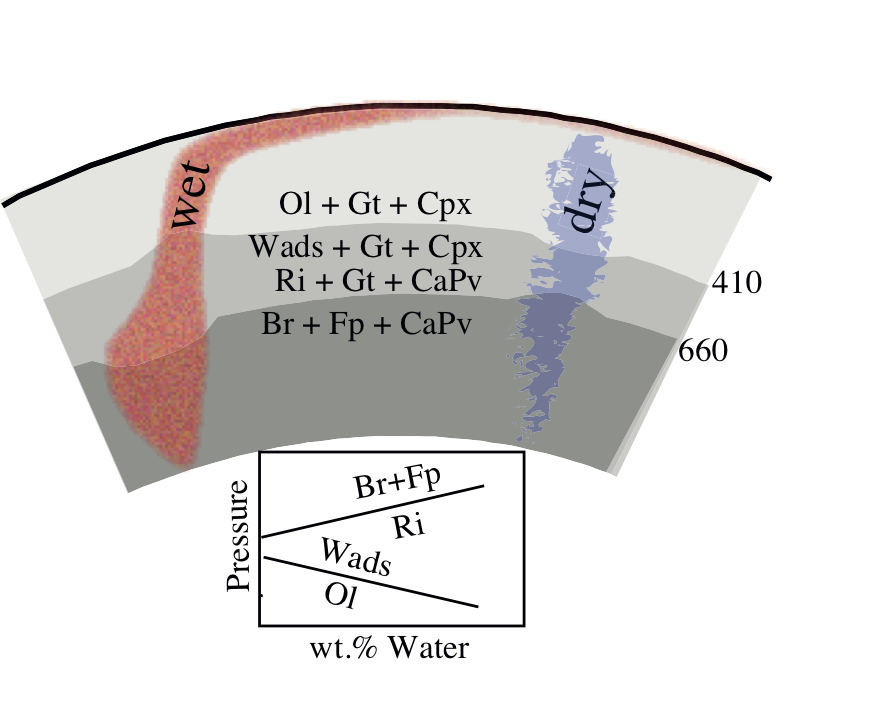
Transition zone topography/mineralogy with water |